Tutorial (Interacting with GUI)
This tutorial explains how to interact with the graphical interface of the output from this server.
1. Mouse hover
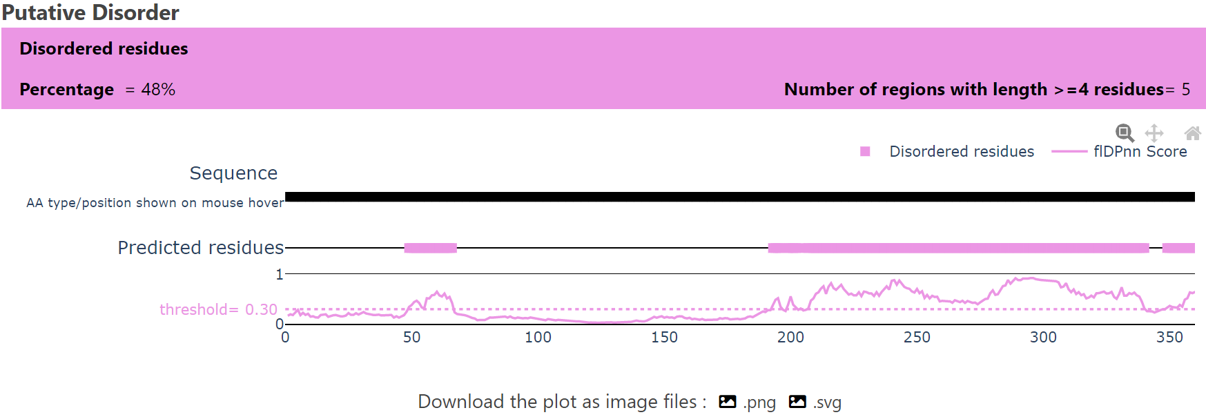
Detailed information of each residue is shown on hovering the mouse over each point on the graph.

Hovering shows information including amino acid (AA) type, AA position, predicted region and predicted propensity score.

2. Zoom
To zoom-in from position A to B, place the cursor at position A, then pressing the left-click button on mouse drag to the right up to position B and release the mouse button.

The X-axis is now zoomed between position A and B.

To return to the original view, either double-click on any point inside the graph or click  icon.
icon.
3. Pan X-axis

4. Click on legends
Single left-click on a legend hide / show the trace on the graph.

Double-click on a legend isolate that trace and hides the other trace on the graph.

5. Download image


